
Introduction
For process manufacturers—especially those in the Food & Beverage industry—safety is paramount. Yet, the complexities and economics are often undervalued when it comes to quality. Most companies have a general idea of their cost of quality but don’t routinely sit down and analyze the total costs and what could be done to lower them.
As it turns out, the cost of quality is a valuable performance indicator that can significantly impact a company’s ROI. Quality is an important attribute that influences brand reputation, and it can therefore play a significant role in shaping a company’s future. It can also be the difference between hours spent on rework and time dedicated to more products sold at the total price.
Quality plays a significant role in shaping a company’s future.
In this guide, we’ll encourage you to look at quality to see what it can do for your company. Throughout the coming pages, we’ll discuss:
- The factors that go into determining the cost of quality mode
- How to capture the true cost of poor quality, as well as opportunity costs
- How failures impede production
- Ways to reduce your company’s cost of quality
First, we’ll begin with a refresher on how the cost of quality is defined.
Cost of Quality is a method of determining the costs incurred to ensure quality.
What are the Costs of Quality?
The total cost of quality can be broken down into two halves: the cost of good quality and the cost of poor quality. These two categories can be further broken down into good quality costs, including appraisal and prevention costs, and the costs of poor quality, encompassing internal and external failure costs.
You can also look at CoQ in non-conformance (poor quality) and conformance (good quality) costs. For example, in non-conformance, the external failures might include warranties and sorting, while internal losses include scrap and rework. For conformance, you could consider the costs of routine inspection, testing, auditing, and prevention efforts such as HACCP plans, worker training, and automation.
Cost of quality
Costs of poor quality
- Internal failure costs
- External failure costs
Costs of good quality
- Appraisal costs
- Prevention costs
Hidden Cost of Poor Quality: A Look Below the Surface
Some of the costs of poor quality (CoPQ) are obvious—for instance, we often look at recalls, returns, rework, rejects, and waste. Yet, when examining the total CoPQ, it’s essential to think more expansively and consider what’s hidden “below the waterline,” including:
- Excessive overtime
- Late paperwork
- Excess inventory
- Premium freight costs
- Unused capacity
- Customer allowances
- Billing errors
- Complaint handling
- Overdue receivables
- Dissatisfied customers
Examples of CoPQ Costs
The cost of non-conformance spans much further than we might think when we look below the surface. External failure costs can include sorting, remaking orders, and breaking into the schedule to remake customer orders since you wouldn’t put a botched order at the end of your line. Travel costs can also add up if you have to visit the customer to address the mishap. Moreover, while it’s difficult to quantify, the cost of customer dissatisfaction or reputational damage can also impact your business financially.
In terms of internal failure, the costs of scrap, rework, and repairs are often obvious. Yet, downtime for quality issues and the costs of expediting raw materials should also be considered.
On the other side of CoQ, there are performance costs to consider. Design choices—or Design for Manufacturing (DFM)—can help you build quality into your product from the start. Other costs include error-proofing, Failure Modes & Effects Analysis (FMEA), training at all levels, quality management systems, automation, and audits.
Appraisal costs
Regarding appraisal costs, you’ll need to look at product inspections, product testing, receiving inspection, equipment for inspections and testing, maintenance and calibration, and all labor and materials. When you put these numbers together, it often becomes clear that one bad batch is too many—especially in an industry like Food & Beverage, where quality issues can have disastrous implications. To that end, most companies are willing to spend what it takes to
fix the problem and use full root cause and corrective action tactics to identify and address issues.
For instance, many companies face containment penalties or controlled shipping after delivering flawed products. This might mean a requirement of 100% inspection for the defect until the process is under control. In some cases, this could be a period of 30 days, but for others, the requirement might be indefinite. While you could outsource the task at $30 an hour for three people, 16 hours per day, 20 days per month, the cost of third-party containment would be upwards of $29,000 per month.
The CoQ curve illustrates the rising costs of proactive quality management compared to the decreasing costs associated with quality improvements. For companies with low failure or non-conformance costs, it might make sense to spend less on proactive quality management and to spend money on each error as it arises simply. On the other hand, when non-conformance costs climb high (as is often the case in Process Manufacturing), there’s more incentive to prevent issues from happening in the first place.
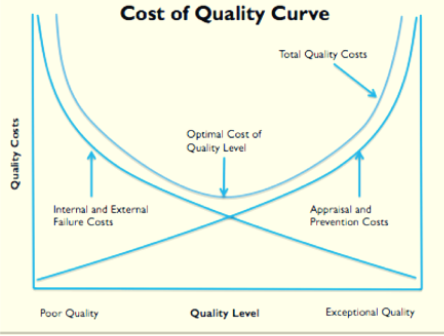
The CoQ curve
The CoQ curve shows us that appraisal and prevention costs are probably low when you have poor quality, but you may have a high internal or external failure rate. Conversely, when you spend more on appraisal and prevention, the costs of non-conformance are likely much lower. The optimal CoQ is somewhere in the middle, where your company can strike an appropriate balance between failure and prevention costs.
To formulate a true CoQ for your company, it’s important to first understand the true costs of internal and external failure and then invest appropriately in prevention and appraisal methods to mitigate those risks. Ultimately, cost avoidance should be a form of insurance. To find out if it’s hurting or helping your business, add up your HACCP plans and find out what they cost. That’s your prevention/detection cost or your insurance.
CoPQ = Free Money
CoPQ comes right off the bottom line. Some customers punish companies with crushing costs, so manufacturers often spend whatever it takes to prevent non-conformances. As such, savings in CoPQ can essentially be viewed as “free money,” which you can invest in quality. To determine what you’re saving, look at what you’d spend in:
- Replacement costs or remaking orders
- Expedites to replace orders
- Travel to customer
- Containment costs
Once you’ve determined this figure, you can compare it against your prevention and appraisal methods. For instance, you can decide if your investment in PFMEA/HACCP is an asset or liability. Is the cost of the control plan worth it—does it cost you less to avoid more? Use your control plan to drive CoPQ down and meet your targets.
Poor quality really starts to hurt profits when your plant is at full production capacity. It can mean missed sales resulting in an increase in the cost of poor quality.
Opportunity costs
Opportunity costs are defined as the loss of potential gain from other alternatives when one alternative is chosen. In other words, what else could you have been doing while you were doing rework? How much profit could you have earned if you were building products to sell instead of throwing away scrap?
While their opportunity costs are often overlooked in CoQ, they should be built into your CoQ model for a more comprehensive analysis. For example, some companies may justify their opportunity costs with the reasoning that if they have the time to do rework and re-runs and never miss on-time shipments, it surely can’t be having a major impact on their business.
Yet, poor quality really starts to matter when your plant is full. In these scenarios, every bit of time you have is dedicated to producing quality products, so rework must be done on overtime. When you start losing capacity, customers’ orders back up, and lead times get longer. In this sense, CoPQ is a capacity killer.
Scrap needs to be addressed
Other companies might think that scrap isn’t a problem that needs to be addressed. For instance, if you can melt down your aluminum scrap or regrind plastic, it might seem as if you’re losing almost nothing. Or, if you pay your employees an hourly wage anyway, what harm is there in having them sort parts? Yet, you can’t think of it in terms of the cost of raw materials or labor alone—you’ll also need to consider what the cost of the missed sale was. As an example, while it might seem as if you only lost $2 of raw material in scrap, you’re actually losing $5, the amount for which the final product would have sold.
Without considering opportunity costs, CoQ might amount to 5-10% of sales. Yet, when you factor in missed opportunity costs, it could be closer to 30%.
How to Reduce the CoPQ
According to a SafetyChain poll, most respondents are either focused on improving internal failures or controlling all costs of quality, including prevention, appraisal, internal failure, and external failure costs. Regardless of your company’s specific pain point, here’s what you can do to start reducing the CoPQ now:
- Identify opportunities for cost reduction
- Quantify the true cost of the problem(s), including opportunity costs
- Prioritize improvement actions
- Take actions to improve
- Evaluate your success as cost reduction
- Sustain your gains and continuously improve
Remember that it will likely make sense to focus on the “low-hanging fruit” first or the opportunities that will enable you to reap the most significant gains with the least effort. You may need to brainstorm with colleagues using tactics like Pareto charts to determine the best opportunities.
CoPQ Case Study: Plastics Extrusion
One plastic extrusion company determined that their CoPQ was $300 per month or $3,600 per year. They determined this based on the rate of customer rejections and internal re-runs, which totaled three to four per month. According to their math, the rework of molding and paint defects amounted to 2.5% of their sales. Yet, the plant was at total capacity, and the company failed to factor in some essential details. For instance:
As a 720 piece order, the cycle time of three parts per minute amounted to four hours of rework
The machine charge time was $600 per hour, and there was an additional hour needed for setup. Because the rework was being done on the weekend, operators were being paid time and a half The cost of additional inspection and packaging amounted to $250 The parts sell for $2.10, representing the opportunity cost. What originally was determined to be a $3,600 CoPQ for the year was actually $233,000.
With all these factors added up, the average cost of a re-run was $4,870—or more than the company originally estimated as their CoQ for the entire year. With four per month (48 per year), the annual cost was actually $233,000 per year—without factoring in the costs of customer annoyance and staff time spent on RMAs and other administrative work.
To put into perspective just how bad the CoQ can get, consider Takata, formerly the world’s largest airbag manufacturer. After a U.S. recall that affected 42 million vehicles that resulted in fines, payouts, and bankruptcy, their value quickly plummeted from $400 billion yen to $4 billion.
FAQ
How can you convince company leaders that tracking CoQ is a worthwhile activity?
Money is executives’ preferred language of choice, so use this to make your argument. In fact, you can present your CoQ findings to them without first asking whether they should be tracked. By expressing problems in dollars instead of less tangible terms (i.e., “unhappy customers”), you’ll be more likely to get their attention. In other words, it’s not about convincing executives that CoQ is worth tracking but using hard data to illustrate its importance and make a business case for improving it.
How do raw materials fit into the CoQ equation?
While you could include raw materials as a separate line, an easier option is to build it into your selling price. For every item, you didn’t sell due to scrap/rework, look at the selling price (opportunity cost), which should already have the raw materials factored in.
How does QMS software fit into the CoQ equation?
QMS software falls under the cost of conformance, but it can also fall under appraisal costs. The cost of software, including annual licensing, is a prevention cost on the conformance side. Using the software (to perform hourly checks, for example) would fall under appraisal costs. Note the time savings you can achieve when factoring software into your CoQ equation.
Thus, if you were spending $10,000 on checks previously, you could expect to spend closer to $2,000.
Software users see a time savings of 80% when upgrading from manual methods for quality checks.
Where should CoQ reporting be directed?
You’ll want to engage your accounting teams in conversations related to CoQ, but it’s also important to discuss CoQ reports in any setting when you evaluate company KPIs. This could be during monthly meetings, for instance. In fact, CoQ can serve as its own valuable KPI, as there’s so much information rolled up into one number.
What’s an example of “error-proofing?”
Error-proofing is a quality measure in which manufacturers design a product to be assembled incorrectly. For example, if you’re putting lids on bottles, you might create a lid that can only be screwed on one way to error-proof the design.
Should unplanned downtime due to equipment maintenance be factored into CoQ?
Unplanned downtime typically isn’t a quality issue. Nonetheless, it should still be tracked separately; for instance, you might look at it when determining OEE (overall equipment effectiveness).
Conclusion
Measuring CoQ can be enlightening for process manufacturers. Even if you think you have a grasp on what your company’s CoQ may be, taking a closer look often reveals details you may have missed.
For instance, even if your company doesn’t face high non-conformance costs, failures erode production capacity and could wind up driving your profits down by hundreds of thousands of dollars each year. For companies in industries like Food & Beverage, the risks of non-conformances are simply too significant to overlook.
By stepping back and looking at your CoQ through a new lens, you can identify opportunities to strategically invest in the cost of good quality and strike the right balance for your company. Reducing the cost of poor quality and investing in the cost of good quality has never been more tangible, as the advances in software have enabled manufacturers to improve production (OEE, SPC), quality (in-process checks, mobile forms, digital records), and compliance (audit management, supplier management).
Understanding the value of software adoption for both your brand and business can help increase yields, maximize productivity, and ensure compliance to gain or create a competitive edge in the market.